GET WM Dashboard is Here
All your key metrics, visualized and personalized—meet the new GET WM Dashboard.
In logistics, clarity is everything. At GET WM, we’ve always believed that the right data—presented the right way—can turn a good operation into a great one. That’s why we’re proud to introduce a powerful new feature inside GET WM: The GET WM Dashboard.
Your KPIs, All in One Place
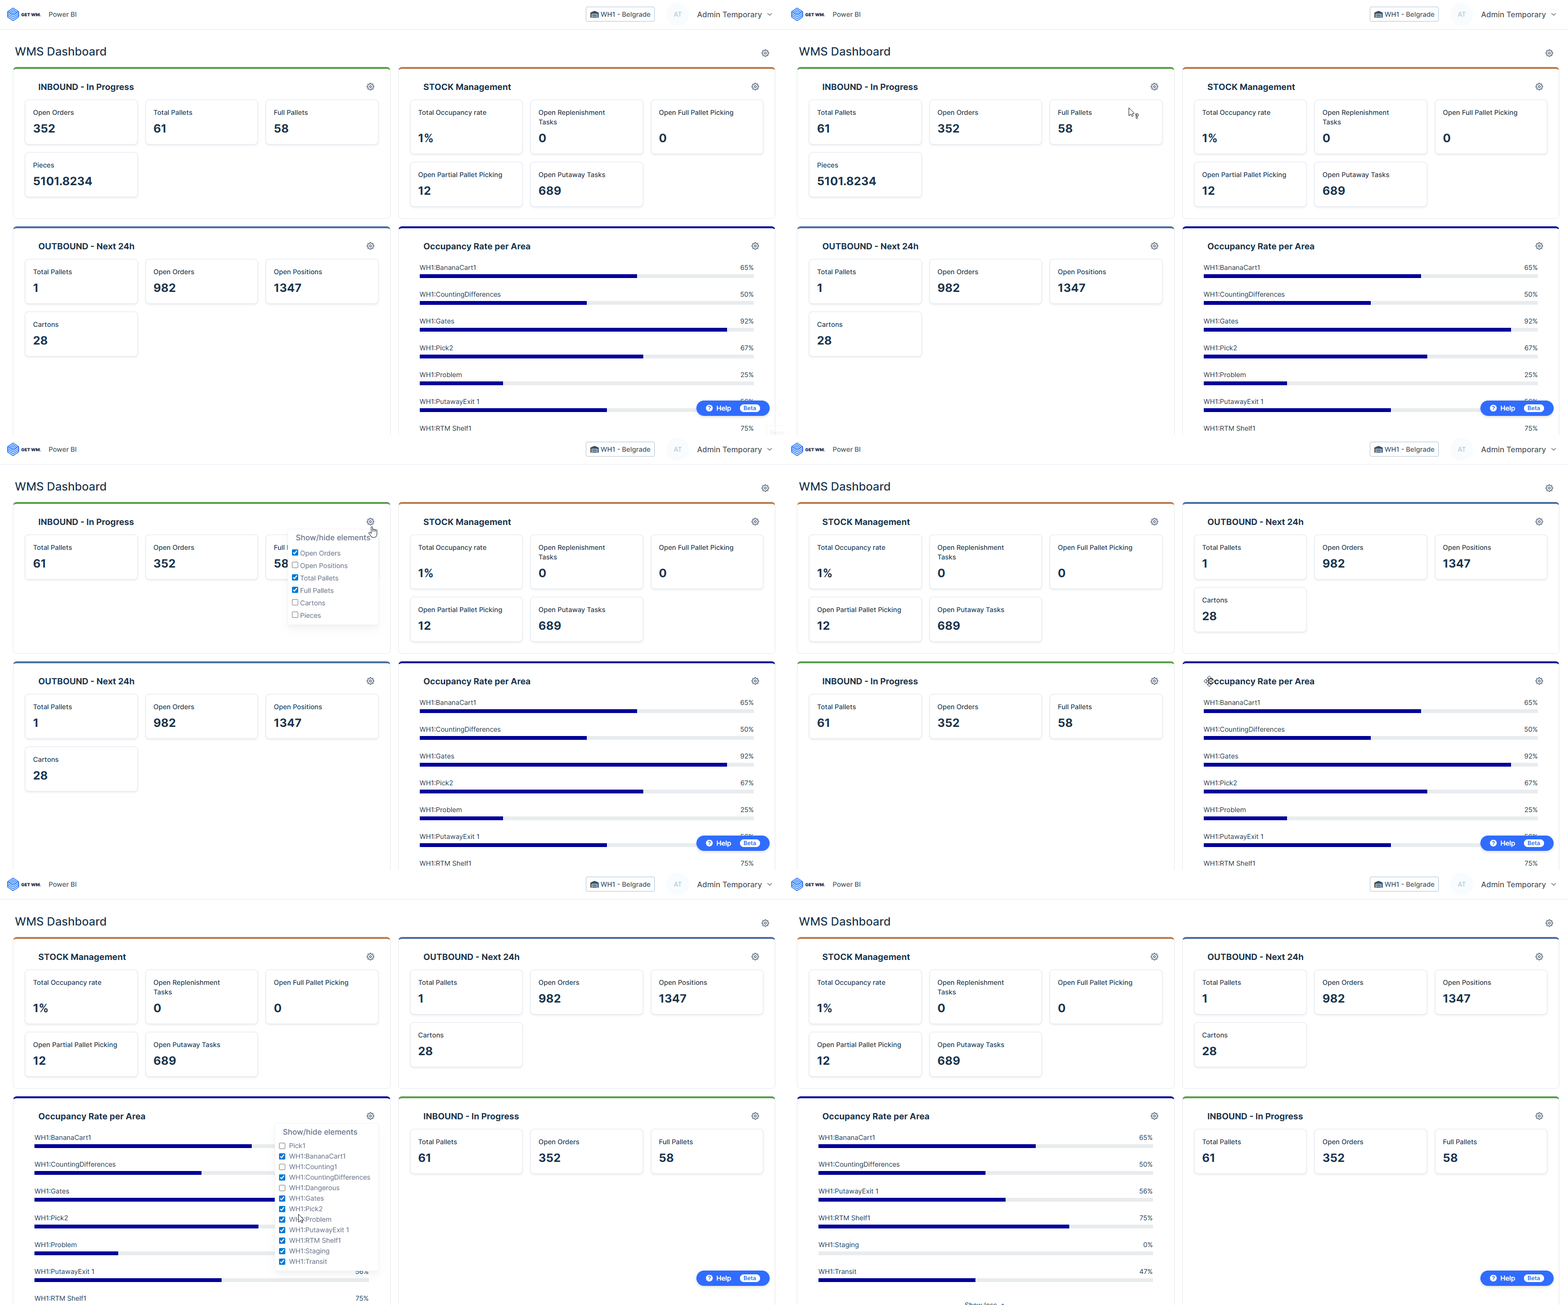
Forget hunting down reports, clicking through tabs, or stitching together metrics from different modules. The GET WM Dashboard brings your most important Inbound, Outbound, and Stock Management KPIs together—on a single screen.
At a glance, you can track:
- Open positions and orders in progress
- Total pallets, cartons, and pieces
- Real-time occupancy by warehouse zone
- Pending putaway and picking tasks
- And much more…
Every key number. Every decision driver. All here.
Tailored to You – Because No Two Warehouses Are Alike
Your operation is unique. Your dashboard should be too.
With our new drag-and-drop interface, you can now:
- Choose what data you want to see
- Decide which warehouse segments to monitor
- Reorganize your widgets to match your workflow
- Save personalized views for each team or role
Whether you’re a shift manager tracking open orders or a supply chain director watching utilization across multiple zones, you’ll see what matters most—to you.
Smarter Decisions, Faster
The new dashboard is more than just a pretty interface. It’s a decision cockpit. By visualizing the live heartbeat of your warehouse, it helps you:
- Prioritize tasks like replenishment and putaway
- Catch bottlenecks before they grow
- Allocate resources with confidence
- Improve service levels—without digging through reports
Ready to Go?
The GET WM Dashboard is now available to all users. Simply log in, and start building your own view of the warehouse.
Because the future of logistics isn’t just automated. It’s intelligently personalized.


